GSB 2023: international infographic

*as per the post on social media https://www.facebook.com/GSBioblitz/
*as per the post on social media https://www.facebook.com/GSBioblitz/
The NEMBA Alien Species South Africa Project produced 203 Invasive species
187 Invasive Plant species
7 Invasive Bird species
3 Invasive Fish species
3 Invasive Insect species
2 Invasive Mammal species
1 Invasive Mollusk species
While we understand that a proportion of observations are not of good photo quality to ascertain identification to species level, with time those keen on surveys can only improve their photography skills. We encourage our identifiers to share tips and tricks for their respective taxon groups as well as produce videos and crib notes that we share via our YouTube channel.
Our participation in GSB annually brings much fun being in nature, while feeding foundational biodiversity data to our national datasets, especially that of endemic, threatened, and protected species.
More importantly, GSB data is being analyzed by local government agencies responsible for managing and reporting on biodiversity at the municipal scale.
The South African Red List Plants and Animals Project produced 518 Threatened species
442 Plant species
32 Bird species
16 Mammal species
6 Reptile species
5 Amphibian species
6 Ray finned fish species
Arachnid species are much more difficult to ID to species level from photographs thus will take some time for the experts to provide a list of genera observed.
Note that these are records as per the South African Red List Plants and Animals Project which does not have all taxonomic groups listed.
Huge appreciation to all 1,591 identifiers who contributed a whopping 166,349 identifications.
Southern Africa has made progress in identifying the observations made during the GSB with 48% of observations identified over the 2-week ID period.
Please continue to assist with ids - 48,454 observations are still in need of ID.
A special note of thanks to those identifiers who made over 1000 identifications:
iNaturalist tallies the number of observations made as well as the number of species contributed by each observer. Unless further duplicate observations are made, the number of observations will remain static, and the number of species will continue to increase as more observations are identified.
Though the number of species is dependent on the identifiers, some individuals take on the challenge of observing a wide variety of species, instead of making observations of every organism seen (which will have duplicate observations of species).
A total of 10,011 species were recorded during the GSB 2023. Well done to these participants who made the Top 20 list of the number of species contributed during the event:
While we appreciate every observer who contributed to the 102,069 observations made, we would like to give special thanks to those individuals who contributed over 500 observations during this year's GSB.
A hearty congratulations to all who have participated:
We appreciate everyone who contributed to a successful GSB 2023 - from those who organized bioblitzes, outings, events, diving, climbing, walking, and crawling to those who helped with IDs.
Well done to those who participated for the 1st time - Congo, Zambezi Region (Nambia), Greater Nyae Nyae Conservancy (Namibia), Nkangala (South Africa), Makana & Ndlambe (South Africa).
We hope that everybody enjoyed the event.
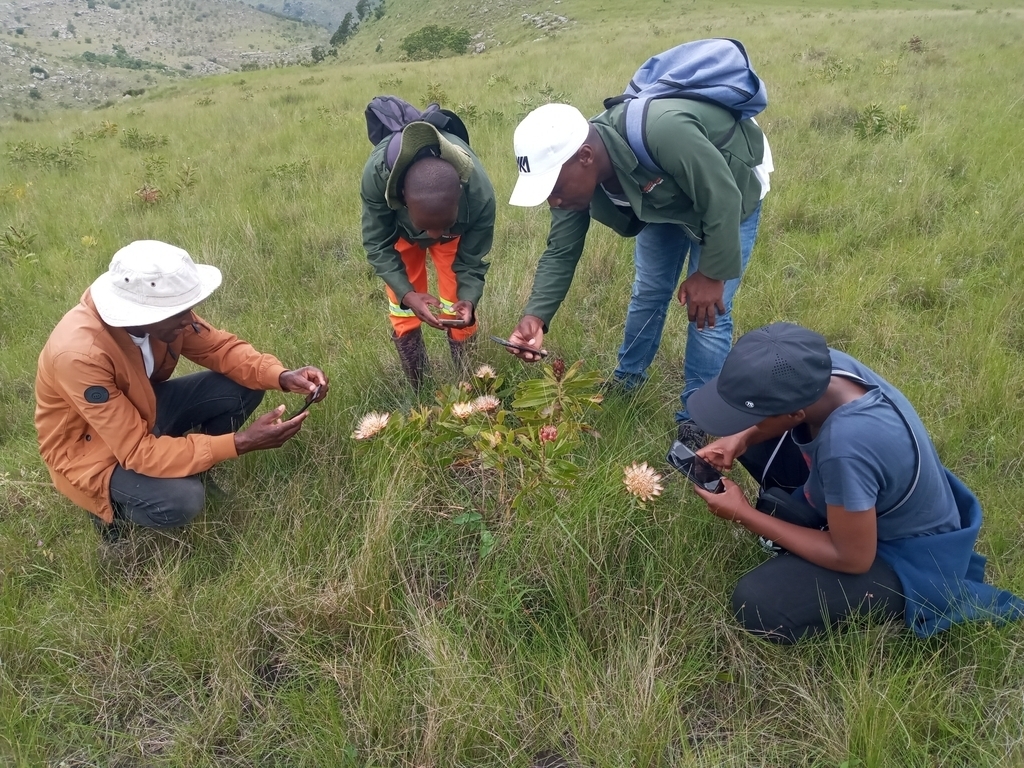
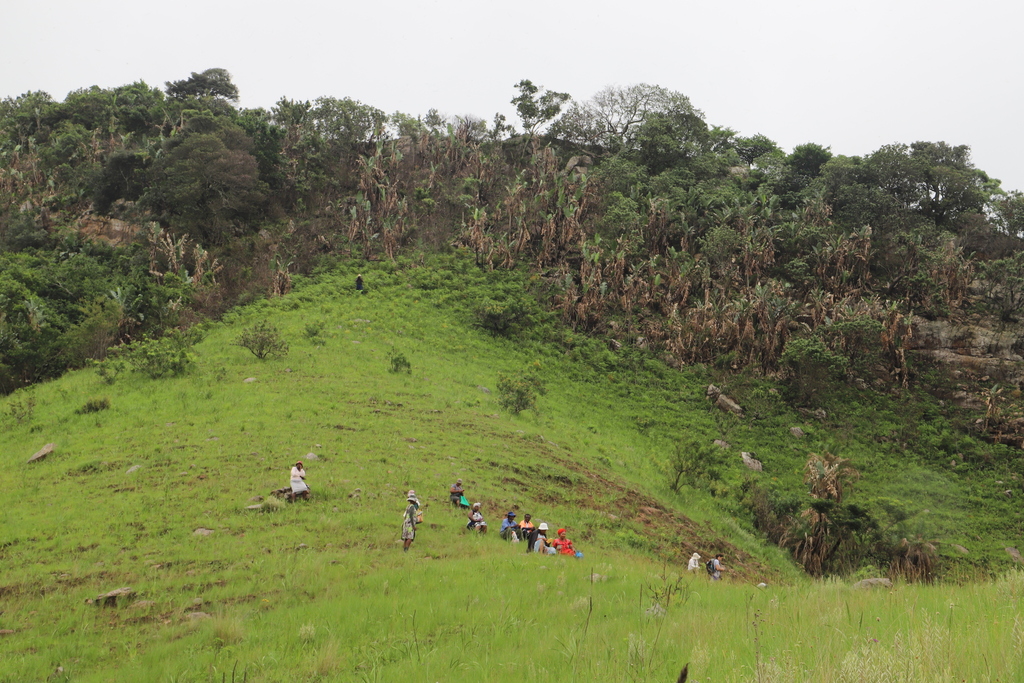
Pondoland team observing Protea simplex @mondempinge | eThekwini's kwaCele community participating in GSB Day 4 @suvarna
Note that the figures and positions on the GSB project are ongoing and reflect the current status and not the situation at the end of the challenge. These will continue to change with time.
The collective results as of 14 December are:
Observations: 231,040
Species: 26,062+, including more than 1317 rare/endangered/threatened species
Observers: 66,394
Most-observed species: Western Honey Bee (Apis mellifera)
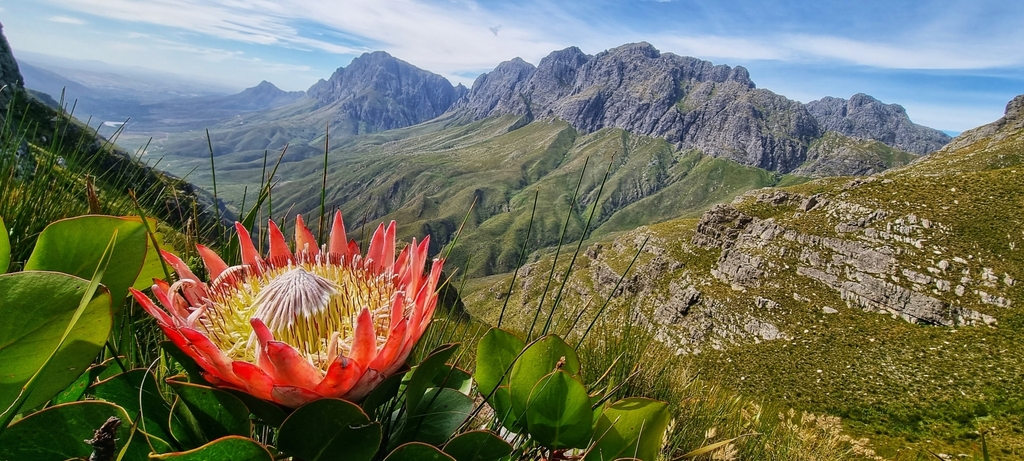
Favourite species: King Protea (Protea cynaroides) observed by @susan828 in Stellenbosch, South Africa
Congratulations to our “Top” cities:
Observations:
Species:
Observers:
You might have noticed that your species counts are not agreeing on different views. For instance:
I will take @magrietb [she asked!, and has only worked in Overstrand] for the GSB2023 as an example as at 13h00 on 12 Dec.
So these are all the same. But if you look at the species seen by Magriet over the 4 days: you will see that she has seen 516 species (here). So where did these extras come from? (or :: what happened to her other species that they are not being totalled?)
This is because "species" means lots of different things in iNaturalist, even on similar pages.
You can see these here:
basically this is the explore filter for @magriet for the competition but with some differences:
https://www.inaturalist.org/observations?project_id=173747&place_id=any&verifiable=any&user_id=660508&view=species
If we add
Note that we cannot tally below species: any subspecies and varieties cannot be reported on: for instance
subspecies :: 19 species
varieties :: 8 species
But note that these are the species summaries: we dont know if she observed only one of each species, or two (or even several) subspecies: only the species tally is shown.
So the difference between 516 and 472 can be found from filtering:
Two things to note: (1) some of these (36 observations) have finer identifications in the taxon, so these wont count as they are not leaves; & (2) the IDs displayed in the summaries are Classes to Subsections (of Genera) - no Species are displayed.
This view gives us the clue to remembering and figuring out what iNaturalist is using when tallying the numbers:
which is a right royal pain when so many of our subspecies are of crucial conservation status!!
Cities from those with the most IDs to the least.
Please visit the city on the Overview page to help out with IDs
To help with IDs of taxonomic groups, please see: https://www.inaturalist.org/posts/87357-progress-with-taxonomic-groups
75 % Botswana South
65 % Nkangala
64 % Makana & Ndlambe, the Albany CoE
60 % Garden Route
60 % KZN South Coast
58 % Lowveld
55 % Cape Town
55 % Greater nyae nyae conservancy
54 % Joburg
50 % Overstrand
48 % Stellenbosch
48 % Nelson Mandela Bay
48 % Mountain Zebra Camdeboo Protected Environment
46 % Overberg
46 % KZN Midlands
41 % impopo
40 % Zambia
40 % Eswatini
40 % Northern Botswana
39 % eThekwini
35 % Weskus
34 % Buffalo City
32 % Zimbabwe
32 % Tshwane
23 % Zambezi Region
22 % Bloemfontein
21 % Rwanda
18 % Mauritius
17 % : Odzala-Kokoua NP
16 % Botswana Central
16 % Gaborone & SE
15 % Kenya
12 % Nairobi
11 % Umzimvubu
11 % Malawi
10 % Pondoland region
7 % Potchefstroom

